BioNeuralNet: Graph Neural Networks for Multi-Omics Network Analysis

Installation
BioNeuralNet is available as a Python package on PyPI:
pip install bioneuralnet
For additional installation details and troubleshooting, see Installation.
Quick Start Examples
Get started quickly with these end-to-end examples demonstrating the BioNeuralNet workflow:
BioNeuralNet Workflow Overview

What is BioNeuralNet?
BioNeuralNet is a flexible and modular Python framework tailored for end-to-end network-based multi-omics data analysis. It leverages Graph Neural Networks (GNNs) to learn biologically meaningful low-dimensional representations from multi-omics networks, converting complex molecular interactions into versatile embeddings.
Core Analytical Modules:
Network Construction: Build informative networks from raw tabular data using strategies like Similarity, Correlation, Neighborhood-based, or Phenotype-driven (e.g., SmCCNet) approaches. [1]
Biomarker Discovery: Identify biological modules and key molecular interactions that drive disease phenotypes.
Disease Prediction: Implement end-to-end supervised disease classification using the DPMON (Disease Prediction using Multi-Omics Networks) module. [2]
Subject Representation: Generate enhanced subject-level embeddings for stratification and clustering.
Visualizing Multi-Omics Networks
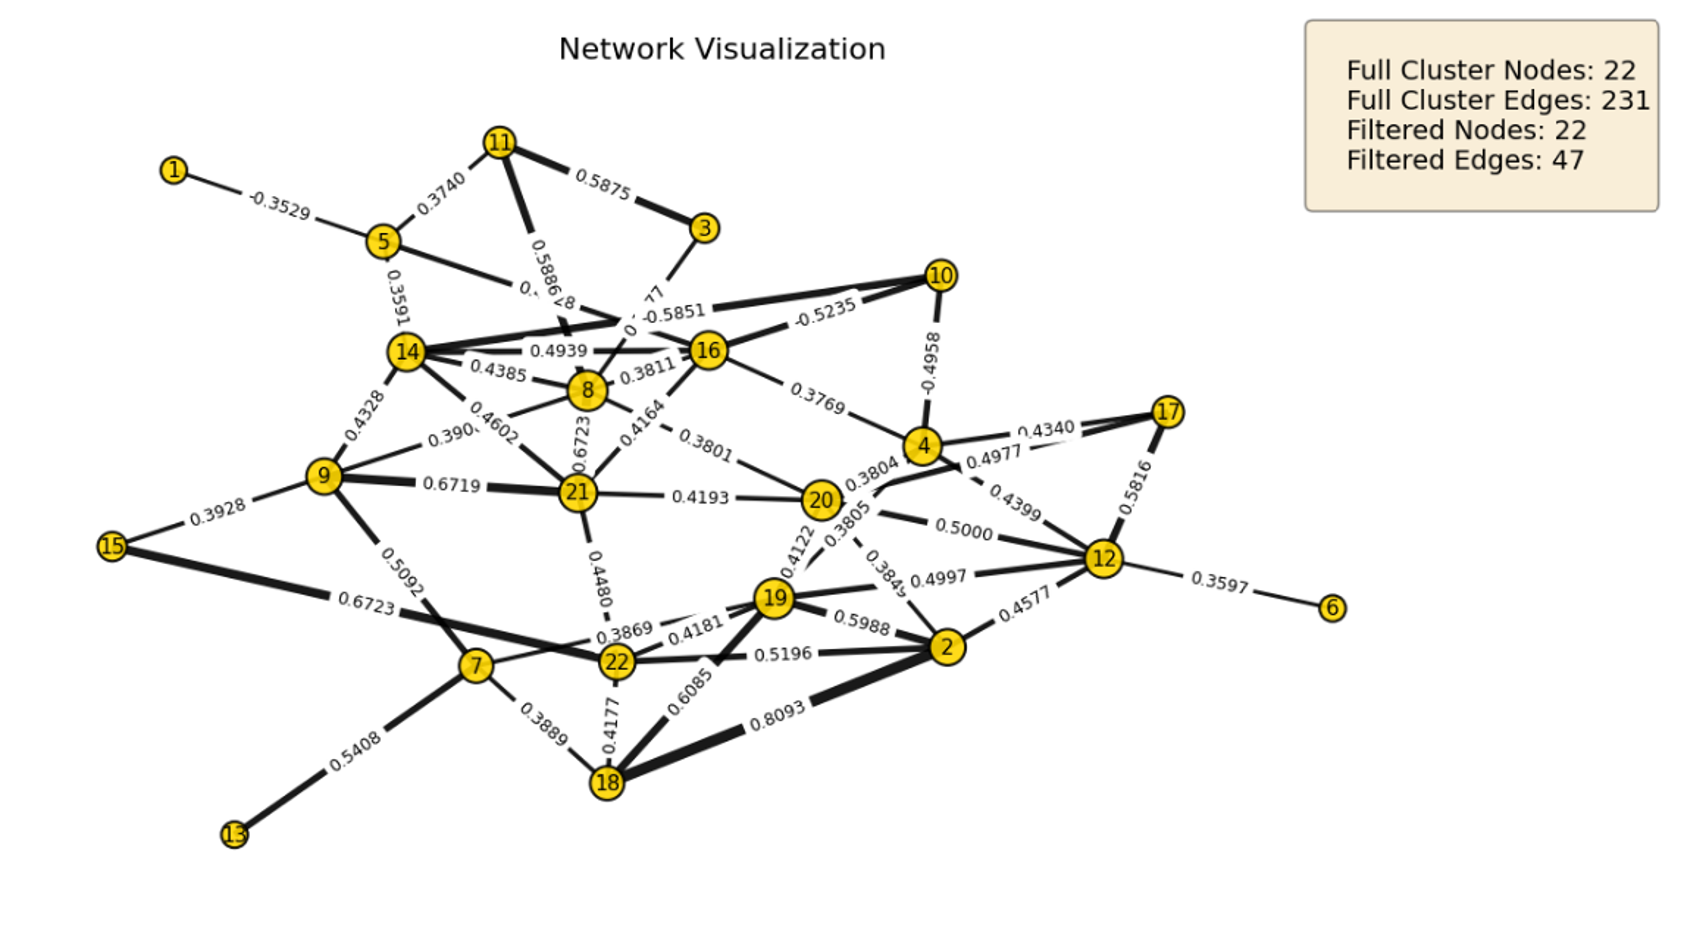
BioNeuralNet allows you to inspect the topology of your constructed networks. The visualization below, from our TCGA Lower Grade Glioma (LGG) analysis, highlights a survival-associated module of highly correlated omics features identified by HybridLouvain.

Network visualization of a highly connected gene module identified in the TCGA-LGG dataset. See Network Full Size
Top Identified Biomarkers (Hub Omics)
The table below lists the top hub features identified in the network above, ranked by their degree centrality.
Feature Name (Omic) |
Index |
Degree |
Source |
|---|---|---|---|
HIVEP3 |
20 |
7 |
RNA |
DBH |
19 |
7 |
RNA |
ERMP1 |
8 |
7 |
RNA |
LFNG |
12 |
6 |
RNA |
MIR23A |
21 |
6 |
miRNA |
THADA |
4 |
6 |
RNA |
Why Graph Neural Networks for Multi-Omics?
Traditional statistical methods typically represent multi-omics data as high-dimensional tabular matrices, often overlooking the intricate relationships and interactions between biomolecular entities. BioNeuralNet overcomes these limitations by using Graph Neural Networks (GNNs) to explicitly model multi-omics data as biological networks.
BioNeuralNet supports several GNN architectures suited to different biological contexts:
GCN: Effective for uniformly connected graphs.
GAT: Uses attention mechanisms to highlight key biological relationships.
GraphSAGE: Designed for large or dynamic datasets.
GIN: Sensitive to subtle feature variations in molecular structures.
Network Embeddings
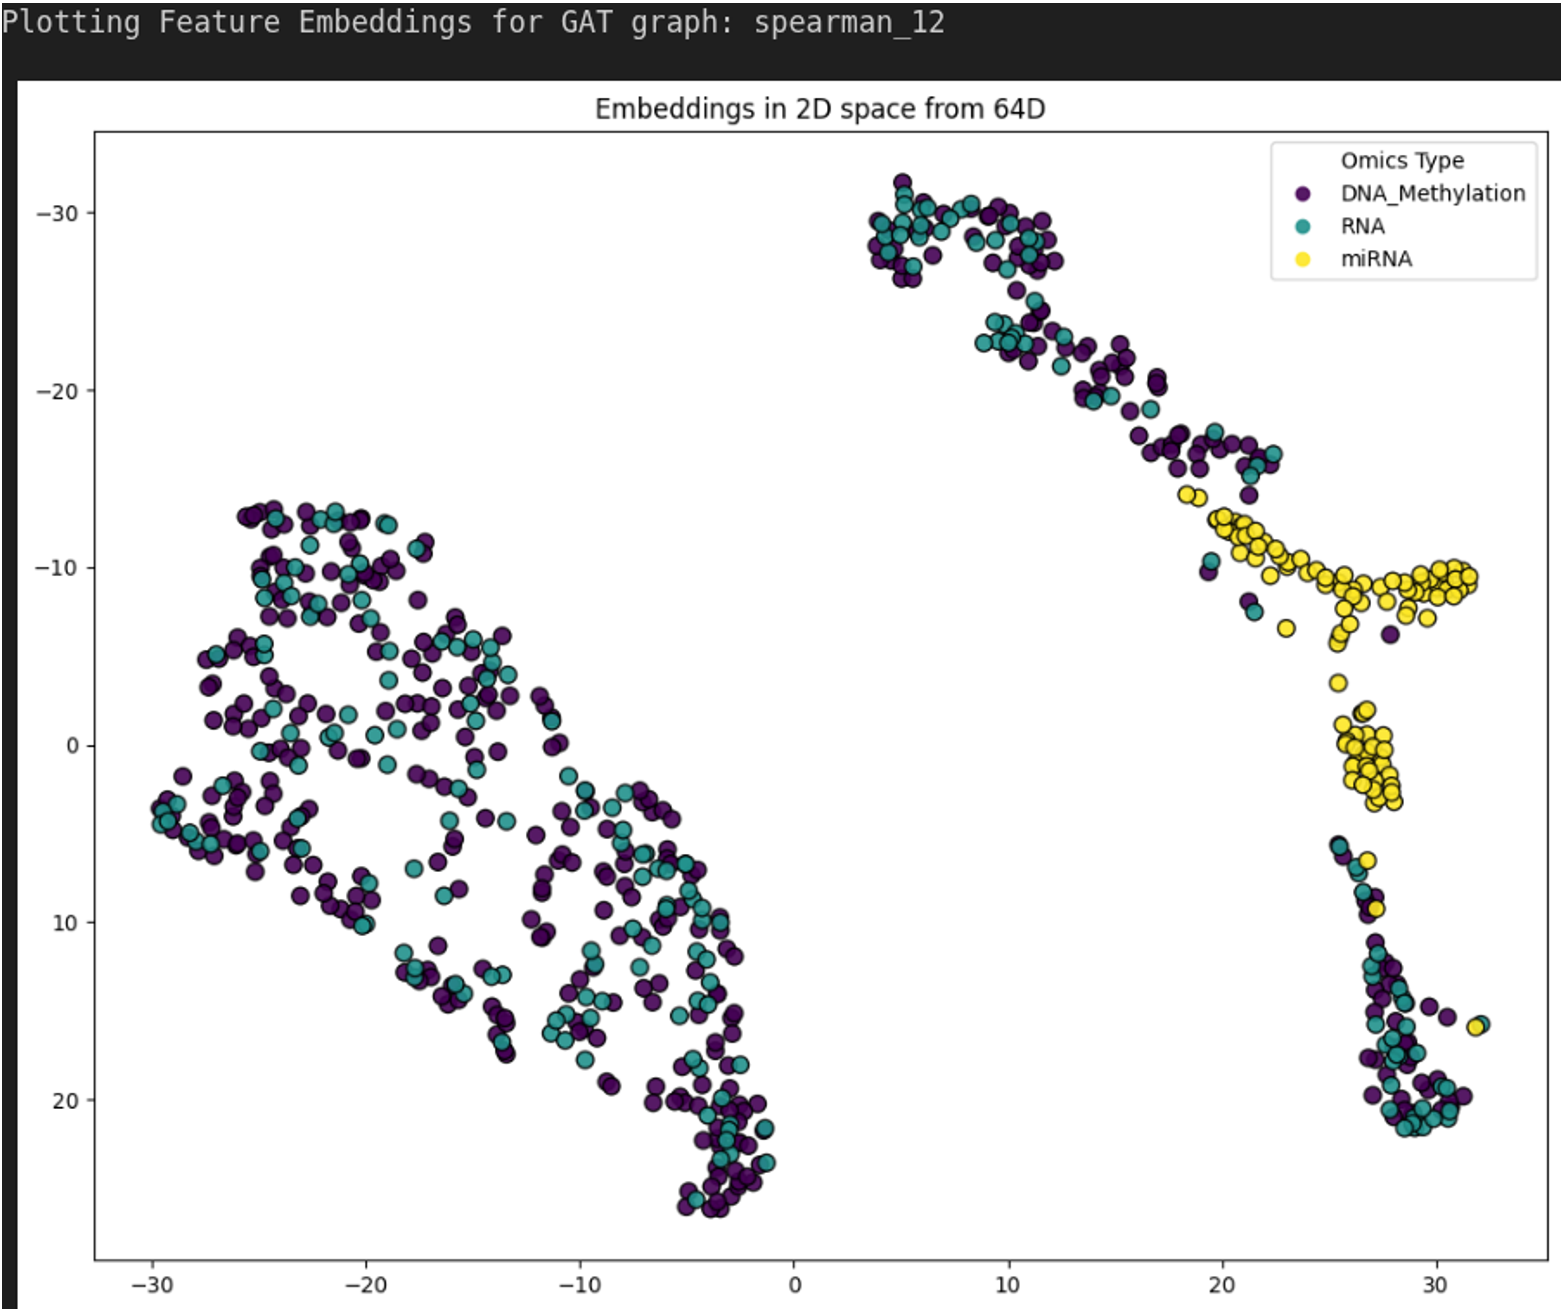
By projecting high-dimensional omics networks into latent spaces, BioNeuralNet distills complex, nonlinear molecular relationships into compact vectorized representations. The t-SNE projection below reveals distinct clusters corresponding to different omics modalities (e.g., DNA Methylation, RNA, miRNA).

2D projection of Network Embeddings showing distinct separation between omics modalities. See Embeddings Full Size
For detailed explanations of BioNeuralNet’s supported GNN architectures, see GNN Embeddings.
Key Considerations for Robust Analysis
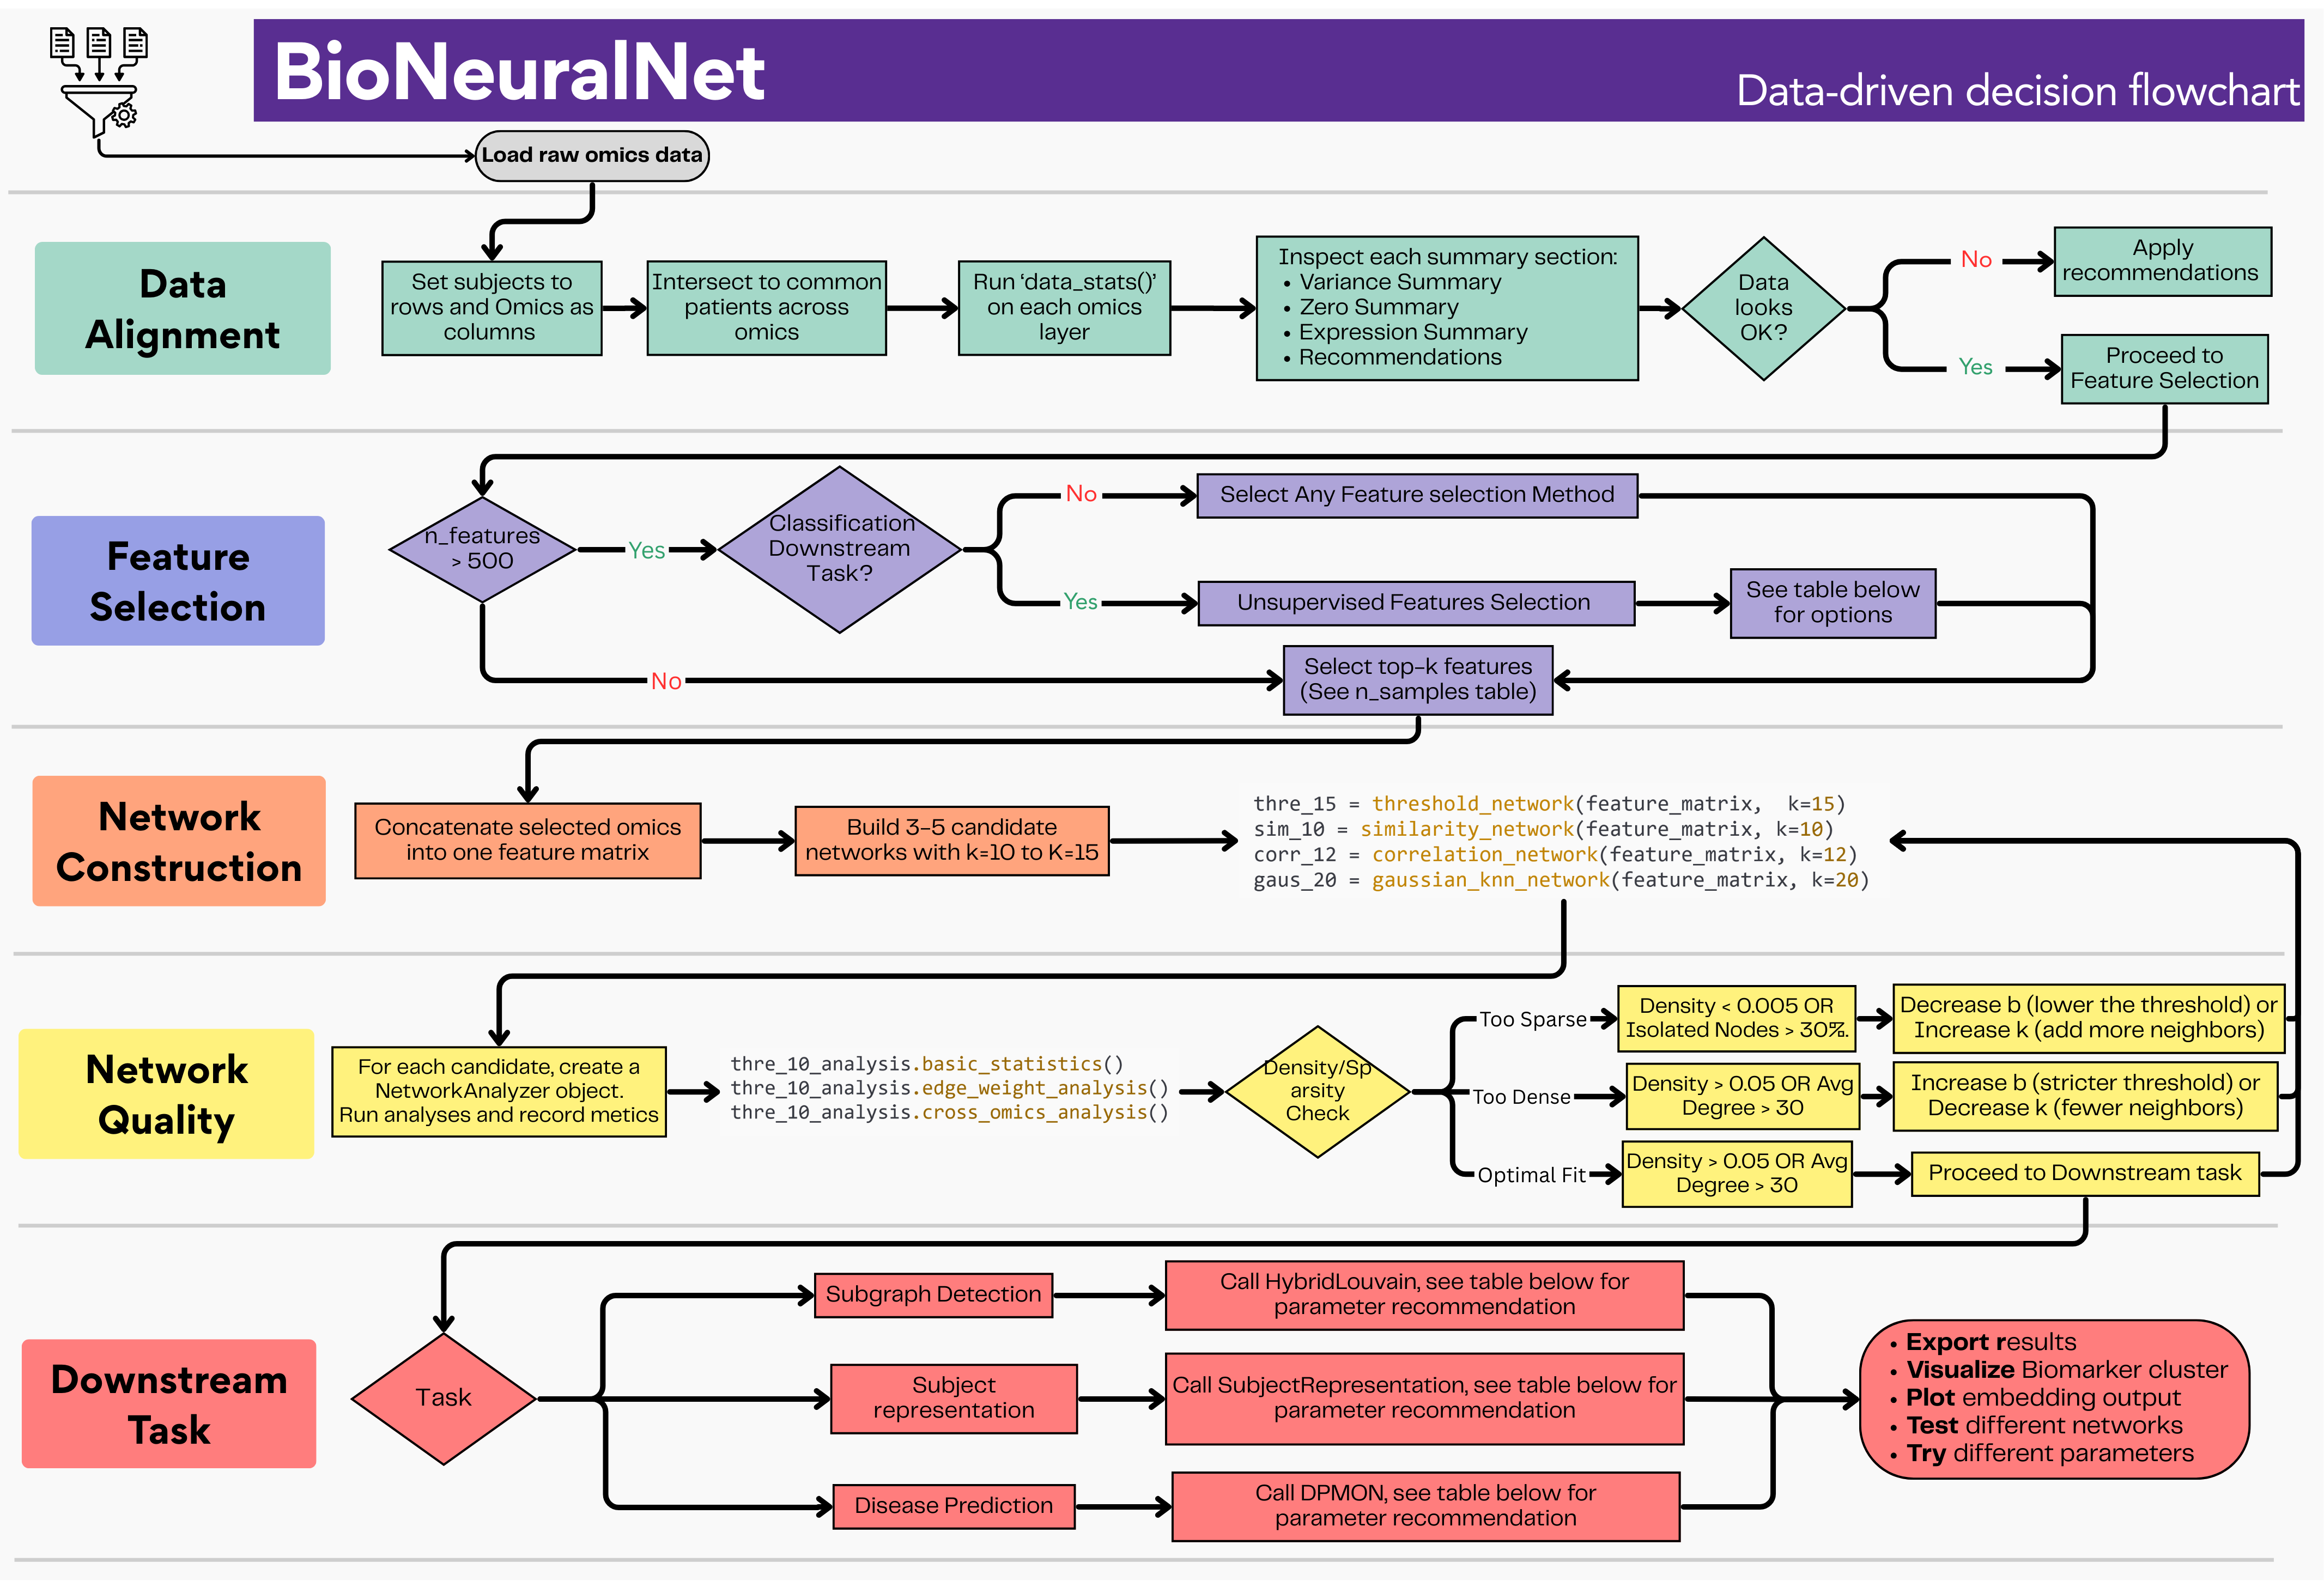
Multi-omics pipelines involve sequential decisions across data alignment, feature selection, network construction, and downstream modeling. Each stage shapes the one that follows. BioNeuralNet provides a structured Data Decision Framework to guide these choices with concrete parameter recommendations grounded in empirical results from TCGA and COPD workflows.

Data-driven decision flowchart for navigating the BioNeuralNet pipeline. See Flow Chart Full Size
For the full stage-by-stage parameter reference, see Data Decision Framework. For preprocessing utilities, see Preprocessing Utilities. Per-cohort feature implementation details are available in the Notebooks.
Explore BioNeuralNet’s Documentation
For detailed examples and tutorials, visit:
Quick Start: A series of walkthroughs demonstrating the BioNeuralNet workflow from start to finish.
Notebooks: A collection of demonstration notebooks showcasing end-to-end analyses on TCGA datasets.
Documentation Sections:
Quick Start: End-to-end notebook walkthrough using a synthetic demo dataset, covering network construction, subgraph detection, and disease prediction.
Data Decision Framework: Comprehensive stage-by-stage parameter reference and decision guide grounded in empirical results from TCGA and COPD workflows.
Notebooks: Demonstration notebooks showcasing end-to-end analyses on TCGA-BRCA, TCGA-LGG, TCGA-KIPAN, and ROSMAP datasets.
GNN Embeddings: Overview of supported GNN architectures (GCN, GAT, GraphSAGE, GIN) and embedding generation.
Subgraph Detection & Biomarkers: Phenotype-aware subgraph detection using CorrelatedLouvain, CorrelatedPageRank, and HybridLouvain, with TCGA-LGG and ROSMAP case studies.
Network Construction & Analysis: Tools for network construction, topology analysis, and automated network search.
Downstream Tasks: Downstream analysis pipelines including DPMON for phenotype prediction and SubjectRepresentation for patient-level profiling.
Metrics and Visualization: Visualization, quality evaluation, and performance benchmarking utilities.
Utils: Data preprocessing, feature selection, imputation, normalization, and network pruning.
Datasets Guide: Built-in multi-omics benchmark datasets (BRCA, LGG, KIPAN, ROSMAP) with cohort summaries and feature selection details.
External Tools: Utility functions for interoperability with R-based tools including SmCCNet cross-validation fold export.
User API: Full API reference for developers and advanced users.
Contributing to BioNeuralNet
We welcome contributions to BioNeuralNet! If you have ideas for new features, improvements, or bug fixes, please follow these steps:
Ways to contribute:
Report issues or bugs on our GitHub Issues page.
Suggest new features or improvements.
Share your experiences or use cases with the community.
Implementing new features:
Fork the repo and create a feature branch UCD-BDLab/BioNeuralNet.
Add tests and documentation for new features.
Run the test suite and and pre-commit hooks before opening a Pull Request(PR).
A new PR should pass all tests and adhere to the project’s coding standards.
git clone https://github.com/UCD-BDLab/BioNeuralNet.git
cd BioNeuralNet
pip install -r requirements-dev.txt
pre-commit install
pytest --cov=bioneuralnet
Citation
If you use BioNeuralNet in your research, we kindly ask that you cite our paper:
Ramos, V., Hussein, S., et al. (2025). BioNeuralNet: A Graph Neural Network based Multi-Omics Network Data Analysis Tool. arXiv preprint arXiv:2507.20440 | DOI: 10.48550/arXiv.2507.20440.